Thursday, August 13, 2009

save a chart to a file format for inclusion in other documents

A chart can be saved in a different file format to be included in other programs by using the copy and paste function. Right click on the chart > copy > paste in another program. You can also use the copy and paste shortcuts when the chart is highlighted use ctrl+c (copy) then ctrl+v (paste) in the other program.

generate and configure charts in a variety of formats

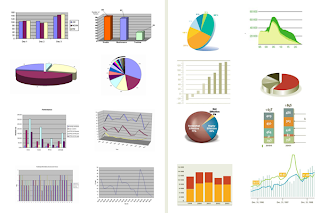
A graph, or a chart as it is known in Excel, is a visual representation of worksheet data. A chart is based on a selection or range of related data. A chart often makes it easier to understand the data in a worksheet because users can easily pick out patterns and trends illustrated in the chart that are otherwise difficult to see.
The quickest and easiest way to create a chart in Excel is to use the Chart Wizard. The Chart Wizard is composed of a series of dialog boxes that give you all the available options for creating a chart.


  1. Choosing the chart type such as pie chart, bar chart, or line chart.

  2. Selecting or verifying the data that will be used to create the chart.

  3. Adding titles to the chart and choosing various chart options such as adding labels and a legend.

  4. Deciding whether to put the chart on the same page as the data or on a separate sheet.

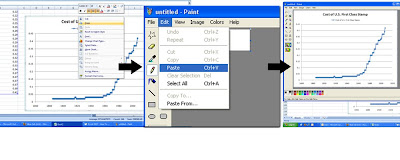
Create a chart in Excel 2007 and in Excel 2003 or change an exisiting chart type in 2003 or 2007 with help from MS online.


display information by using: Filters and Pivot Tables.

The two key tools for filtering and summarizing small data sets are filters and pivot tables. Filters let you see just the items you want, without changing the underlying data. Pivot tables are powerful summary tools, much like statistical software for large databases. PivotTables allow you to create multidimensional data views by dragging and dropping column headings to move data around.
Microsoft online Pivot Tables Tutorial
Filter data in a Pivot Table
Filter data in a range or table

work with data across multiple sheets

To be able to view two or more worksheets at the same time can save a great deal of time.
Microsoft office online can help you understand this:
http://office.microsoft.com/en-us/excel/HP012170431033.aspx?pid=CH100648381033

Sunday, August 9, 2009

configure page layouts

This tutorial by microsoft online explains how page layout view can help fine-tune pages.
http://office.microsoft.com/en-us/excel/HA100215631033.aspx?pid=CH100798591033

manipulate page breaks
microsoft online should be able to help with this.

sort selected areas of the spreadsheet

Sorting data is one of the basics of spreadsheet usage, once it is structured it will be greatly easier to work with. This tutorial will help sort selected areas of the spreadsheet. http://www.ofzenandcomputing.com/zanswers/314

and to an extent this tutorial explains "how to sort data in a range or table"

interchange information with other applications

The most effective way to interchange information with Excel is to use the copy and paste functions. For example to bring data into Access from Excel, you can copy data from an Excel worksheet and paste it into an Access datasheet, import an Excel worksheet into an Access table, or link to an Excel worksheet from an Access table.

This microsoft office online tutorial will help explain how to interchange information from Excel.
http://office.microsoft.com/en-us/excel/HA100963001033.aspx?pid=CH100648471033