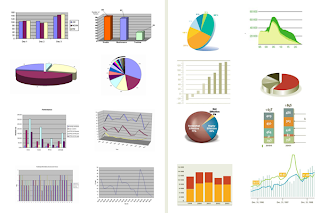
A graph, or a chart as it is known in Excel, is a visual representation of worksheet data. A chart is based on a selection or range of related data. A chart often makes it easier to understand the data in a worksheet because users can easily pick out patterns and trends illustrated in the chart that are otherwise difficult to see.
The quickest and easiest way to create a chart in Excel is to use the Chart Wizard. The Chart Wizard is composed of a series of dialog boxes that give you all the available options for creating a chart.
The quickest and easiest way to create a chart in Excel is to use the Chart Wizard. The Chart Wizard is composed of a series of dialog boxes that give you all the available options for creating a chart.
- Choosing the chart type such as pie chart, bar chart, or line chart.
- Selecting or verifying the data that will be used to create the chart.
- Adding titles to the chart and choosing various chart options such as adding labels and a legend.
- Deciding whether to put the chart on the same page as the data or on a separate sheet.
Create a chart in Excel 2007 and in Excel 2003 or change an exisiting chart type in 2003 or 2007 with help from MS online.


No comments:
Post a Comment